
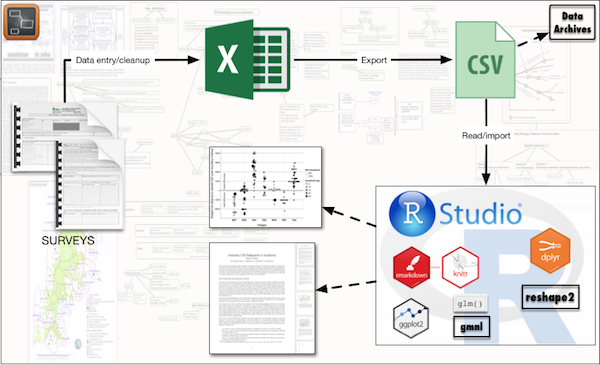
First of all, I use Scapple as a tool to organise my thoughts, brainstorm, and plan my work (background on the figure above).
Most of the data I work with comes from structured surveys. The original raw data is usually entered and cleaned in Excel - primarily because virtually everybody knows how to work with Excel. Once the data is cleaned and ready to be analysed, I export them to .csv format. If the data is also going to be deposited in public data archives .csv is one of the most commonly accepted formats. I then import the data into R for analysis and visualisation. I use RStudio as the main work environment, for data organising and manipulation (using packages like dplyr and reshape2), for analysis and visualisation (packages like gmnl and ggplot2 - also see my other post about my favourite visualisation packages, and also for initial drafts of my reports/papers (using rmarkdown and knitr).
Reuse
Citation
@online{poudyal2017,
  author = {Poudyal, Mahesh},
  title = {My {Data} {Workflow}},
  date = {2017-07-21},
  url = {https://maheshpoudyal.com/posts/2017-07-21-My-data-workflow/},
  langid = {en}
}