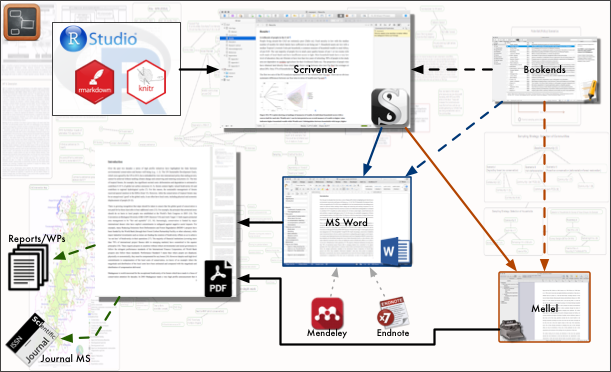
In this post, I outline my workflow for writing up reports, working papers, and manuscripts for journal submission.
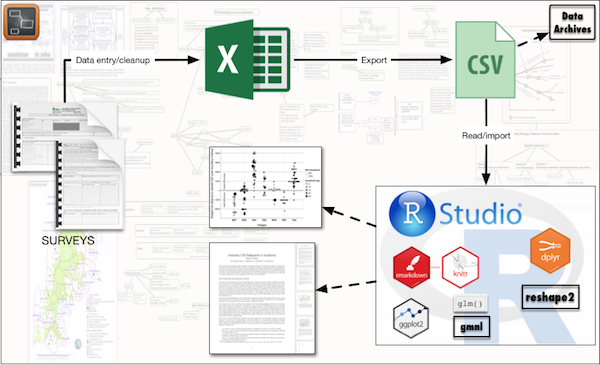
In this post, I outline my basic workflow while working with primary data (quantitative for the most part). Parts of the workflow would be similar for working with secondary data as well.
In this post, I write about two of my favourite data visualisation packages for R (in addition to ggplot2, which has become pretty much a default visualisation package).
Here’s how we used GitHub repository as part of journal paper submission.